Dairy markets: stable or stagnant?
At the 19th September meeting of the EU Milk Market Observatory Economic Board, where I was representing COPA, this question was asked. With supply and demand in reasonable balance, why are farmer milk prices stagnant (in fact, falling in Ireland!)?
We have been repeating it for months: milk output growth among the most important dairy regions has been very modest. Low private powder stocks and empty intervention, though butter stocks have been higher, have only contributed in a limited way to available supplies.
Combined with reasonably solid demand from the likes of China and other Asian countries as well as within the US and the EU, we definitely have a balanced dairy market.
Low milk supply growth – except for New Zealand’s very early season
January to July output for the main 4 milk production region remains in negative territory, at just under 0%. January to June production fell 0.5%, with particularly negative trends in Oceania and South America. Expectations from the EU Commission’s analysis suggests that production will grow very moderately for the second half of 2019.
For the two trough months of June and July, New Zealand production has increased substantially, by 14% in June (absolute trough) and just under 5% for July, while August output went up by 2.22% (milk solids – actual volume was only up 0.8%). Rabobank predicts a full 2019/20 season output for New Zealand between -1% and +1%, depending on spring weather patterns over the next number of weeks coming to the October peak.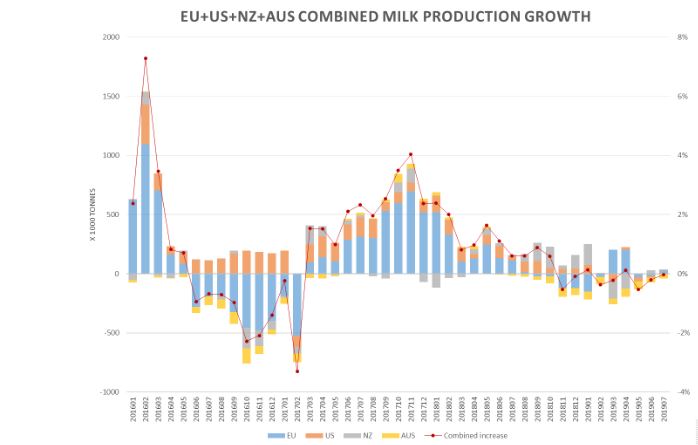
Source: EU MMO
US milk supplies were flat for the first half of 2019. For July and August, output was up only 0.2% compared to the same months in 2018.
Things don’t look good for the future either: cow numbers are down, and there are dire reports of farmers going out of business – with predictions that 10% of the state’s dairy farmers may go bankrupt in 2019 (40% shut down in the last decade).
Farm Aid concerts involving the likes of Willie Nelson and Neil Young have sought to highlight the plight of US dairy farmers.
The causes: low milk prices, and the US administration’s trade and tariff policy which have hampered the US’s ability to export, and resulted in a glut of milk at home. Exports of cheese and other dairy products to China and Mexico have been hampered by countervailing tariffs. Also, soy beans which used to be imported relatively cheaply from China are no longer available as cheaply, so costs have also increased and margins on farms have been squeezed.
Federal aid packages do not appear to have sufficed to compensate farmers for the disastrous impact.
EU milk production has also been relatively flat this year so far, with soil moisture deficits in the late spring and summer the main factors. January to July milk supplies grew only 0.2% (+0.3% for July alone), with Rabobank predicting continued moderate if any growth at all to spring 2020, largely because of tight forage and feed availability and quality expected to continue impacting into winter.
The EU Commission predicts a full-year 2019 milk production increase of only 0.5% compared to the prior year, with strong positive outcomes in Ireland, the UK, Poland and Belgium, and reduced output in France, the Netherlands and Italy, and stable production trends in Germany.
Stocks of powder low in EU, butter stocks less so
SMP stocks – which are now entirely private, as intervention is long empty – are calculated by adding up production + imports and subtracting consumption + export. Both EDA and the EU Commission expect SMP stocks to tighten even further into 2020, as a result of lower production and very strong exports throughout 2019 to date.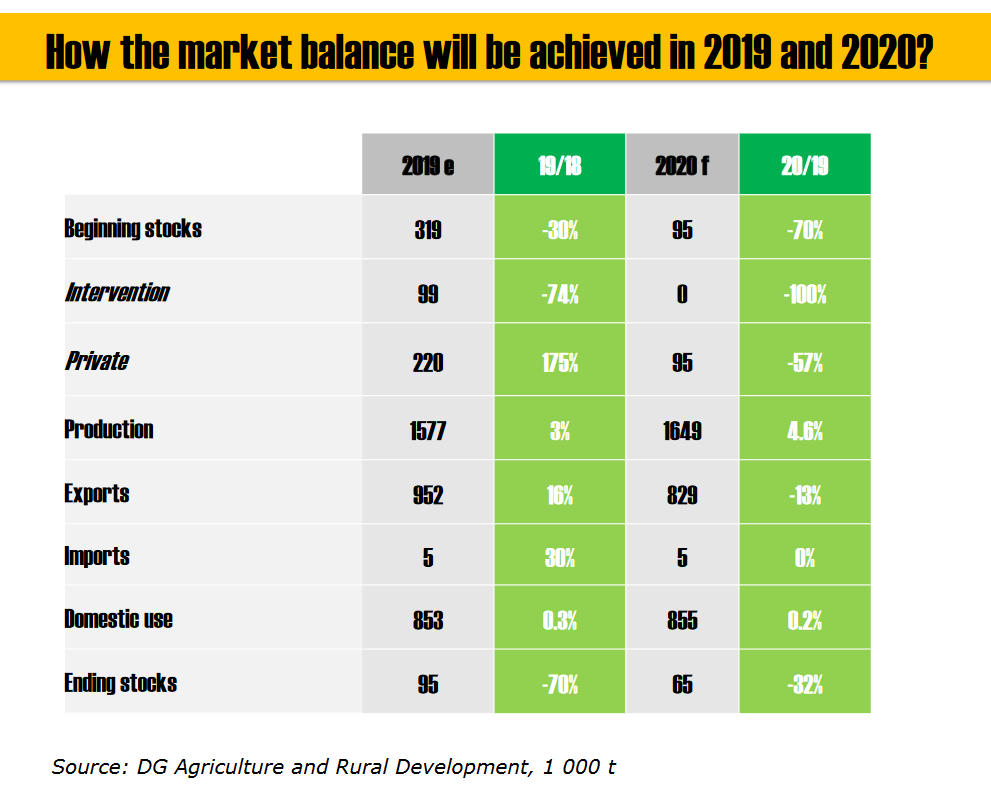 This is expected to have a positive impact on SMP prices, and this is also showing in current average prices, spot and futures quotes (see below).
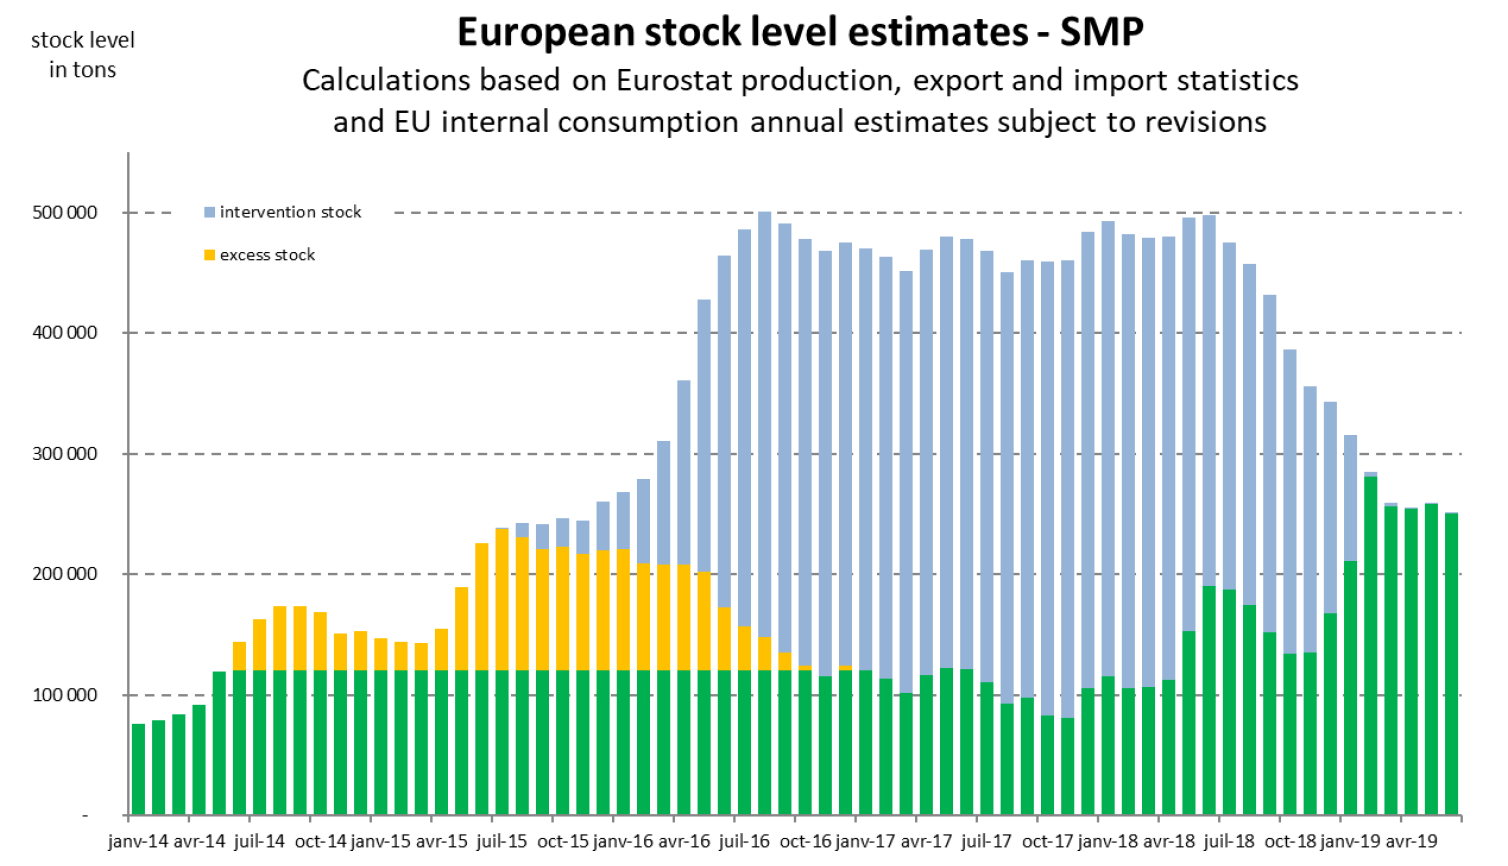
Source: EDA
Privately held butter stocks, calculated on the same basis, are estimated by the EU Commission to be between 20,000t and 70,000t above last year. EDA (graphs below) reflect this. This is high-ish, or more accurately either within normal variations or high, and undoubtedly contributes to keeping a bit of a lid on butter prices. The two graphs below outline EDA’s low and high estimates of butter stock.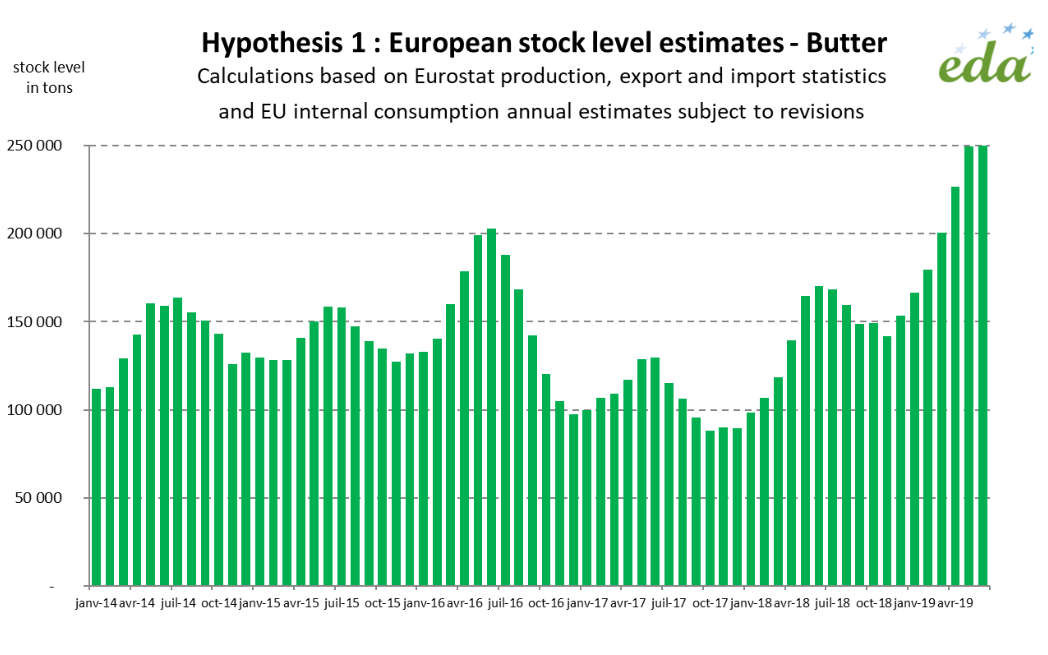
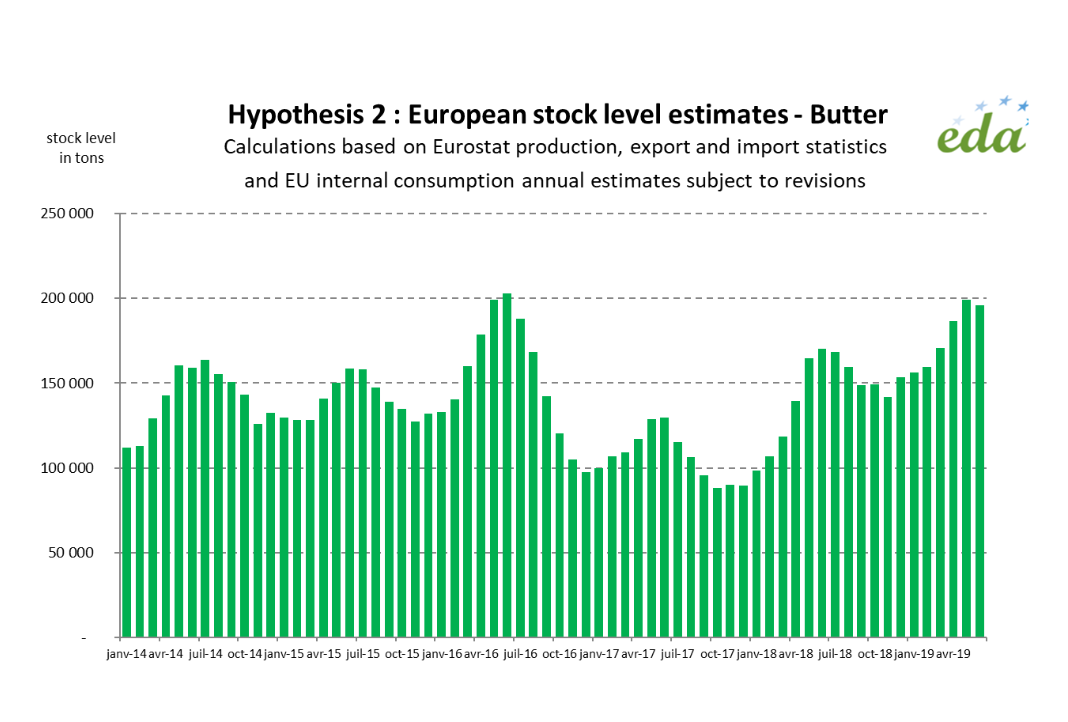 Source: EDA
Demand – EU exports, Chinese imports and global trade all continue strong
The EU Commission’s latest EU MMO report confirms that global demand has been solid, with the exception of whey products. Expectations are for a quieter second half on global trade, partly due to the strong buying in the first half.
EU exports of butter and skimmed milk powder have increased massively in 2019 thus far.
Within a global SMP exports increase of over 6%, EU SMP exports show record growth figures, up a huge 30.6% for the first half of 2019, but the EU Commission warns that trade could slow down as prices increase.
EU butter is competitive in world markets, resulting in 7.4% export growth in H1 2019, and a massive 90% increase in July alone.
EU Cheese exports grew more modestly in H1 2019, by 0.9%, but in the context of global cheese exports rising by 3.7% for the same period.
Where the EU lost ground is in WMP exports, which fell by nearly 22% compared to the first half of 2018, in the context of global export increases of 7.1%, mostly benefiting New Zealand.
Demand in China remains strong, with imports continuing for the Jan-Jul 2019 period on the strong growth trend of the last three years. This is especially true for milk powders (both SMP and WMP) and infant formula. For cheese, China is now the 6th world importer, coming close to South Korea. Chinese butter imports have dropped, to the detriment of New Zealand.
US imports have surged this year, notably for butter (+46%). What will happen to these in the tariff war between the US and China in the coming months remains to be seen.
The whey powder market is highly influenced by the effects of African Swine Fever in China, as this has reduced the national pig herd, consumer of whey based feed, by a third todate – with predictions that culling due to the disease could halve the herd by year end. With China accounting for 50% of world pig production, this is an event of true global scale.
Combined whey exports from global traders have contracted by 13% (-4% for the EU). Yet, EU exports of whey powder to China have increased this year.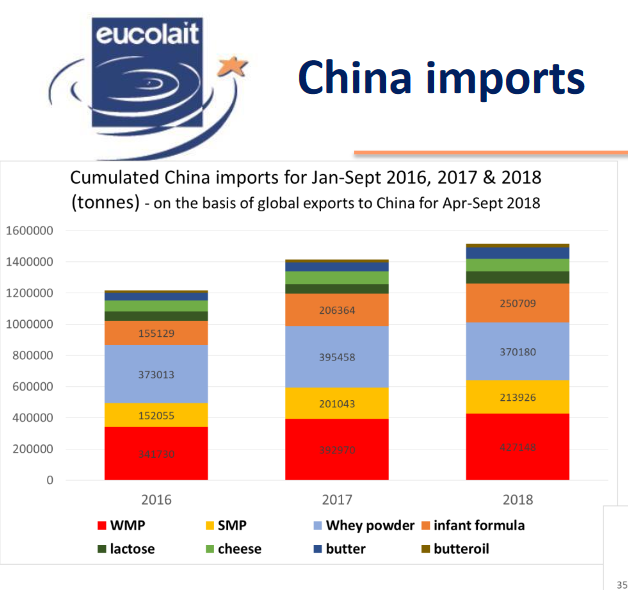
Source: Eucolait
In the butter market, high stock levels keep prices relatively low and therefore encourage trade flows. Global butter exports grew 6.6% in the Jan-Jun period, and within that, EU butter exports performed even better, with an increase of 7.4%.
Top destination of EU butter exports was the US, with over 17,000t exported in the first half, This year. In the Airbus v Boeing EU v US WTO dispute, WTO gave the US the right to impose countervailing import tariffs on dairy products (butter and cheese in particular) which we understand could come into play from October, and upset an otherwise growing trade (including hugely successful and high value Kerrygold butter exports!). Watch this space.
Another interesting element in the examination of global butter exports is India, the single largest milk producing country in the world, which emerges as a major butter exporter, with sizeable volumes shipped to Turkey.
Despite market balance looking set to last medium term at least, sentiment affected by global trade and economic uncertainty
With market in balance, what is worrying operators? According to the EU MMO report from last week:
“Market fundamentals for dairy remain positive and global markets are in relatively good balance due to reduced milk output and strong demand. Sentiment is weakened by Brexit, other geo-political uncertainty factors and worsening trade conflict”
And yet… dairy prices are firming
EU butter prices have fallen by a massive 30% in the last 12 months, but have stabilised somewhat since mid-August, even with some firming.
SMP prices have increased by a whopping 37% since this time last year, and the trend continues gently upwards. While WMP prices are a more mixed story, they too are up, but about 3%, since 12 months ago.
Cheddar cheese, peaked last April for 2019, and have since stabilised above €3050/t.
Whey powder prices have been weak, reflecting global poor trade (see above) linked to lower demand from China.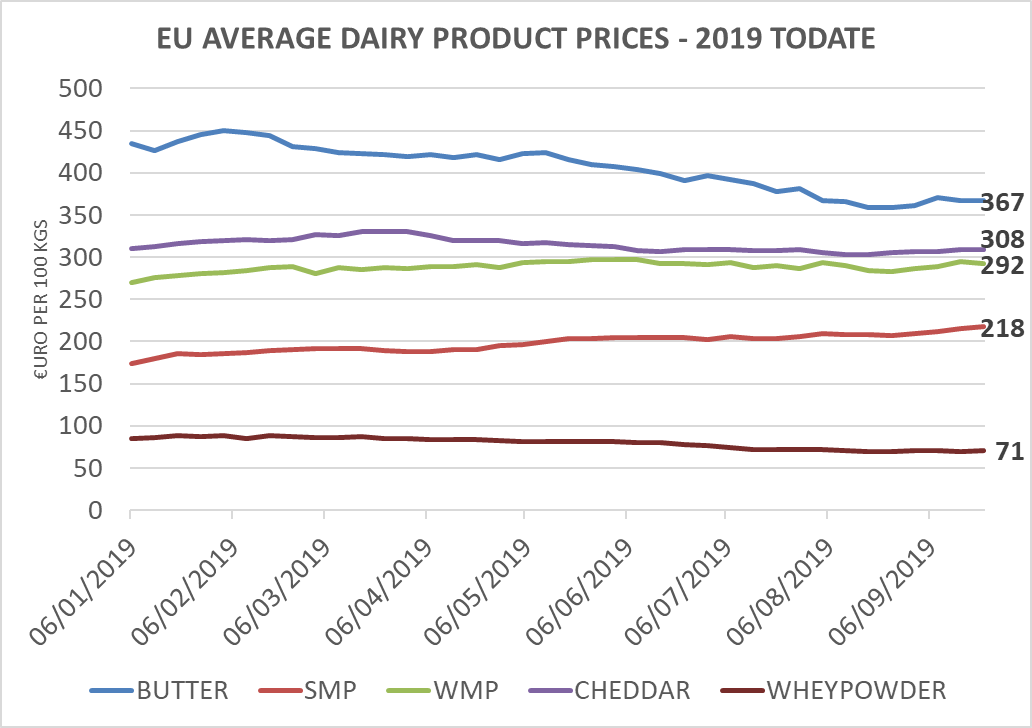
Based on EU MMO data
Spot quotes and futures quotes do suggest some more positivity ahead, though, reflecting a well-balanced supply-demand situation likely to last into next spring, according to the Rabobank Q3 2019 Dairy Quarterly report published last week.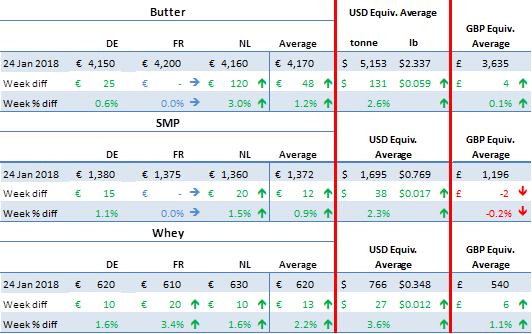
Source: INTL FCStone
Even overall returns for current average dairy market prices have improved, especially SMP and WMP, but also cheese. While butter had firmed a little in recent week, it has eased a little in the most recent week.
For all that, the Irish product mix return, at EU average price levels, would yield a gross 35.07c/l before processing costs, slightly above what it has been in recent weeks, and equivalent to a milk price of 30.07c/l + VAT after deduction of a nominal 5c/l for processing costs. This would be equivalent to a VAT inclusive 31.7c/l – that’s around 1.6c/l more than the simple average of the August milk prices paid by Irish co-ops, as recorded in the Farmers’ Journal milk league.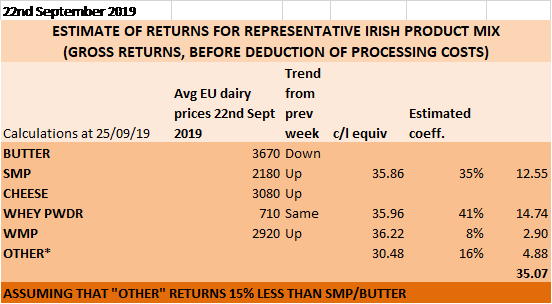
Based on EU MMO data
Considering all the main indicators we monitor on an ongoing basis (EU MMO averages, spots, futures, GDT, Ornua PPI), we have to note that, apart from the Ornua PPI, which would return, for August milk, the equivalent of 29.22c/l + VAT (30.8c/l incl VAT), all other indicators would return an Irish milk price equivalent net of VAT in excess of 30c/l – a not insignificant improvement in recent weeks.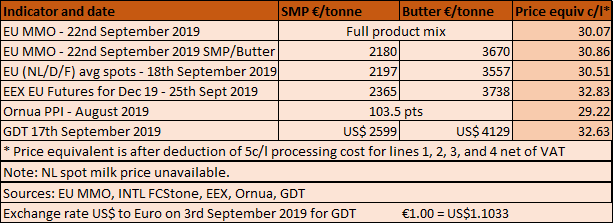
European milk prices are stable… yet Irish milk prices have been falling
EU MMO reports and LTO reports agree: EU average milk prices have stabilised in recent months, and look set to at worst stay firm for the medium term at least, in light of the fact that markets are well balanced.
The EU MMO reported average EU milk producer price as in the graph below shows stability for the last three months at around €33.5/100 kgs.
Source: EU MMO
Irish milk prices, on the other hand, have been falling in recent months, with most co-ops applying cuts of between 2c/l and 3.3c/l since January (there was also some small cuts by some co-ops last November), so that we estimate the current(August) 3.3% protein, 3.6% fat Farmers Journal league simple average would work out at around 28.5c/l + VAT (30.04c/l incl VAT). This average is however heavily influenced by the West Cork Co-ops, and some of the main milk purchasers are paying just over 27c/l + VAT (28.5c/l incl VAT).
For the last EU MMO Economic Board meeting, our LTO colleagues have released their July milk price review ranked by price, and it clearly shows the three Irish co-ops included in the review, Glanbia, Dairygold and Kerry, firmly at the bottom.
It is worth noting that most milk purchasers are holding their milk prices for August and September, and that the gap between the LTO average and the price paid by two out of three Irish co-ops included has widened further as both Glanbia and Dairygold have cut their August milk price.
This brings the gap between Irish milk purchasers and the average LTO price to €2.93/100 kgs, leaving Irish dairy farmers at a unique disadvantage relative to their European counterparts.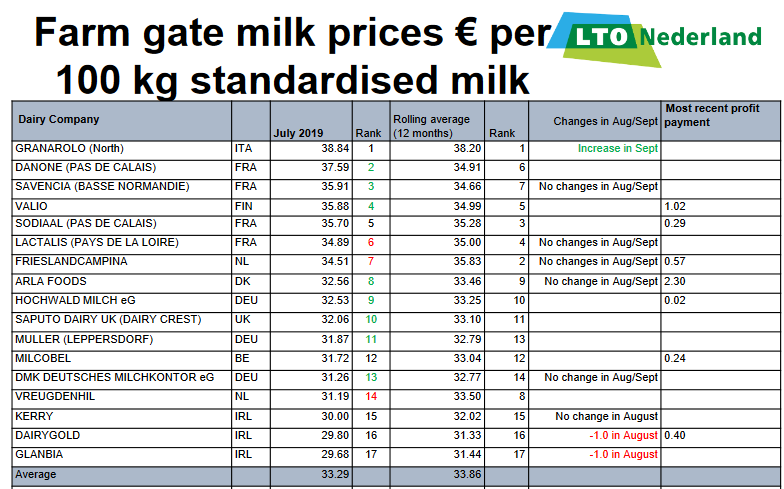
Source: LTO Nederland
Conclusion: Rabobank predicts supply/demand balance could even past spring 2020
The Dairy Quarterly Q3 2019 report, published last week by Rabobank, concludes that, despite slowing global economic activity and uncertainty, “the outlook for demand growth is more than enough to absorb the modest volumes of increasing milk flows, and the current general firmness in global markets is expected to remain through mid-2020”.
This should help make Irish co-ops rethink their pricing policy over the coming months!
The following is the Rabobank summary view on the factors which will be relevant to dairy markets in each of the main regions: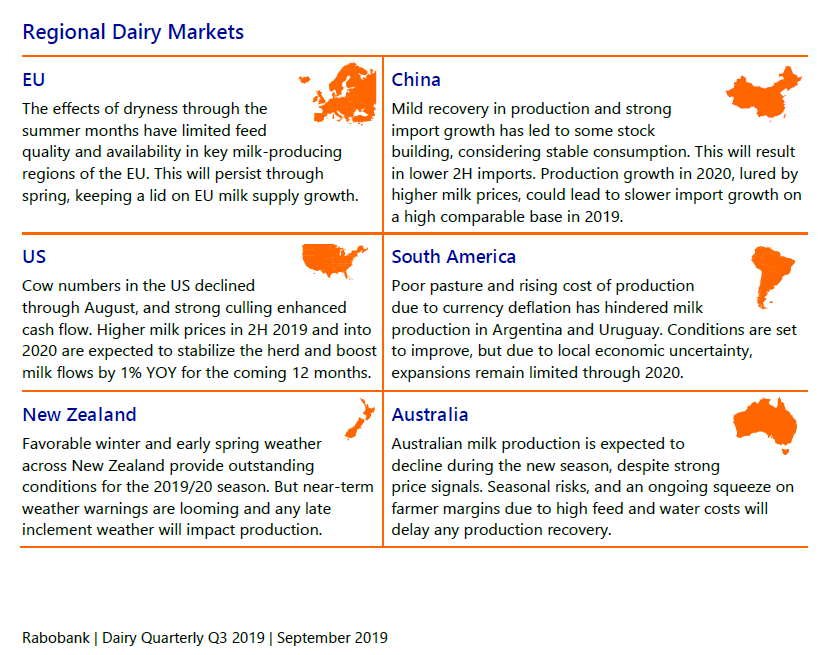
Source: Rabobank