Some real positives on dairy markets for early 2019
1. Less milk about
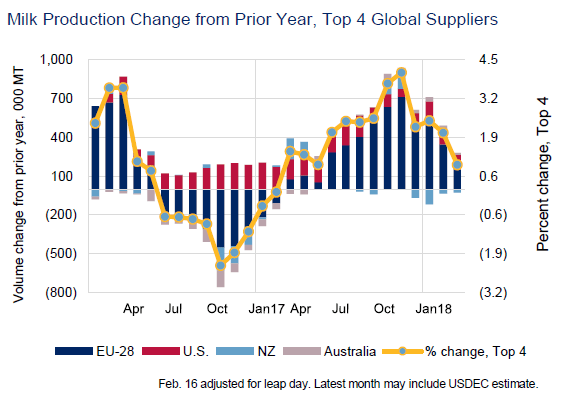
Global supplies of milk have continued to grow into October, but, at an estimated +0.6%, this is at a very much more modest pace than heretofore.
Weather related fodder shortages and cost shocks continue to impact EU (-0.4% in Oct; +1.4% ytd), and Australian (-5.7% in Oct, -0.6% ytd) output.
While the US continue to show positive growth (+1.1% ytd), it is relatively modest at +0.8% for Oct.
Of the main dairy regions, only New Zealand is motoring on, up 5.8% for Oct, and up 2.2% for Jan-Oct.
Slightly less important in tonnages produced is Argentina, though Oct supplies were +2.1% – compared to a low performance this time last year – and ytd + 5.6%. Brazil was down 0.2% Jan-Sept.
European supplies, while well down on the whole for October, show a mixed picture when one look at individual producing countries.
France, Germany and the Netherland account for, between them 46% of the EU’s milk supplies, and 51% of its dairy exports. Those three countries are all producing less milk this back end than last year, the Netherlands at least to end the year with less milk than 2017 – France produced 4.4% less milk in October, Germany -1% and the Netherlands -5.5%.
UK milk supplies were practically static at +0.4% for October, despite very strong growth in Northern Ireland, suggesting lower output in the rest of the UK.
Finland reported losing 50% of its grass crop to the drought over the summer, so that production will be down 0.5% this year and the Finns predict it will fall a further1.1% next year.
Austria’s milk supplies are also down, and the Italians expect their milk production to fall in the last quarter of 2018.
Supplies from other countries, on the other hand, have staged a recovery after the heat wave and drought of the summer. Ireland most of all increased October production by 20.1%, raising January to October output by 2.8%, with expectations of further significant growth in November. Denmark is also showing some growth, while Poland continue to grow production by over 2% ytd.
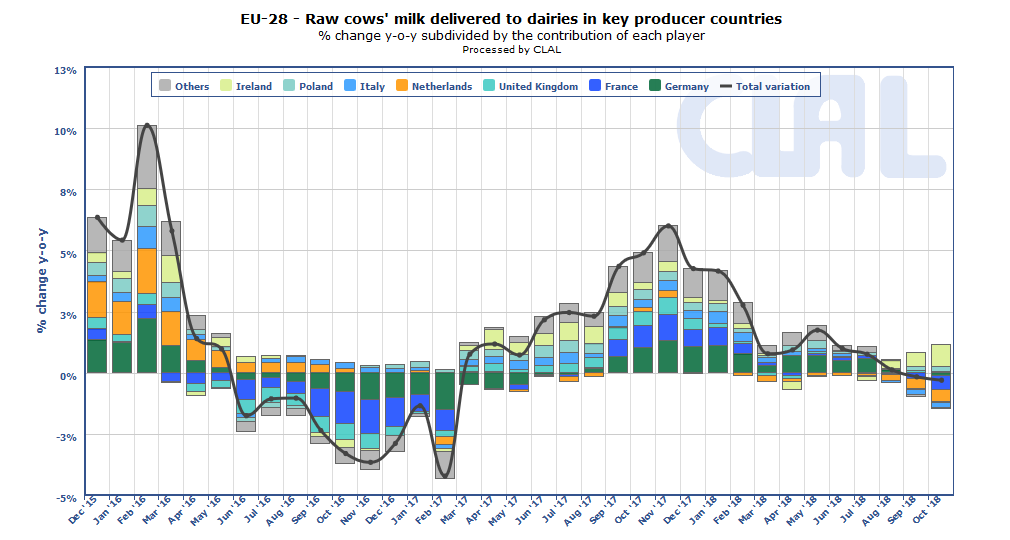
Source: CLAL.it
2. A turnaround in GDT trend?
Today’s GDT auction was the second positive one after a long stretch of price falls since last May. Are we seeing a turn-around? NZ supplies have increased massively in recent months, but we are now well past the NZ peak, and ahead of the Northern Hemisphere main season. Concerns over slower and even negative supply growth in the short to medium term is clearly influencing even Oceanian price trends.
At US$3928 (€3454/t), the average GDT butter price is up 4.9% on the previous auction, but remains well below current EU average butter prices. At $2042/t (€1796), GDT SMP prices are a little above rising EU levels.
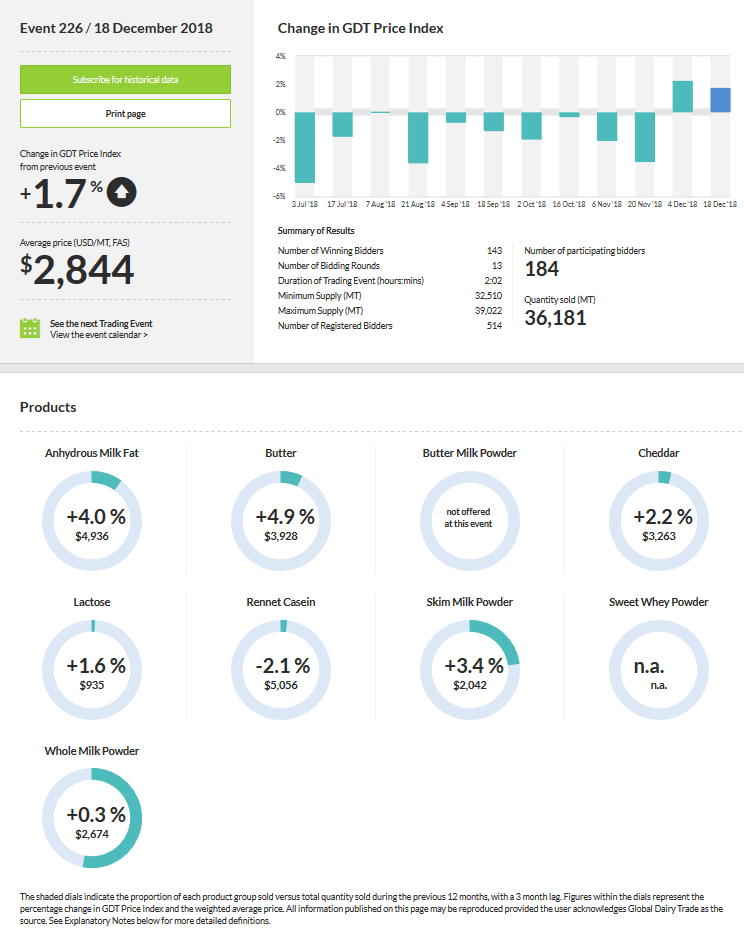
Source: GDT
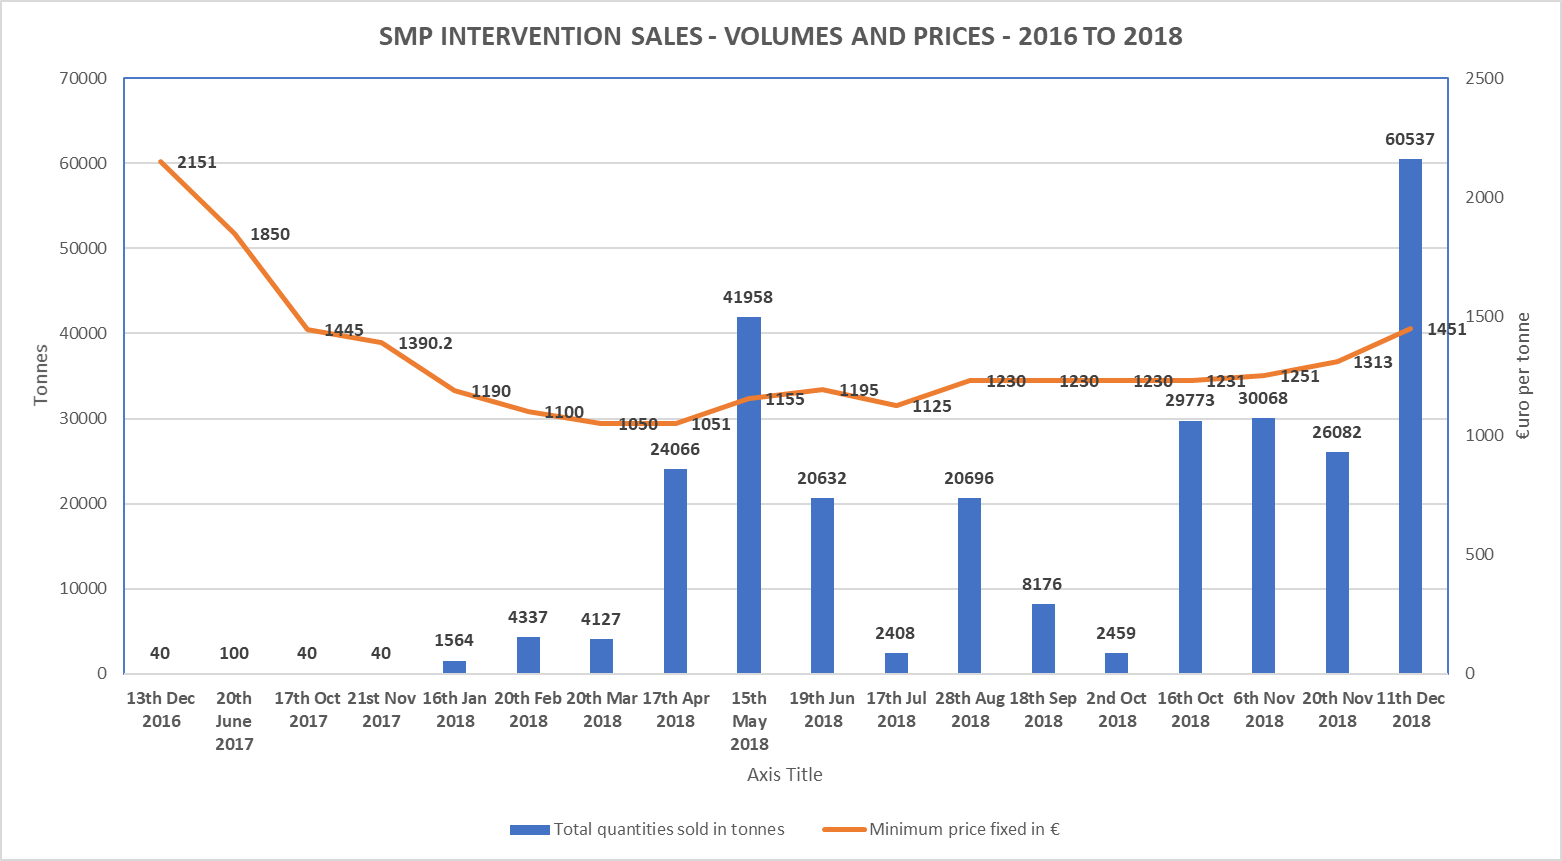
3. More SMP selling fast out of intervention at rising prices
SMP has been open for buy-in since 2014, in the wake of the Russian embargo on all EU foodstuffs. A total of over 405,000t was sold into intervention between 2015 and 2017. There was no SMP accepted into intervention in 2018, and after a couple of unsuccessful tenders, operators got the message and stopped offering it in.
In 2016, 40t of SMP were sold out. In 2017, this increased to a still modest 180 tonnes. 2018 saw the bulk of the sales, with 276,883t sold out by the last December 2018 tender. From October, the number of monthly tender was doubled to 2, though December had only the one.
Next January, the totality of what is left in stock namely just over 102,000t, will be available for the next two tenders.
EU Agriculture Commissioner Phil Hogan has seriously suggested that the entire stock could be gone by next spring.
The most interesting aspect of the intervention sales is how they have increased in pace while the sales price has also been increasing.
Based on: EU MMO data
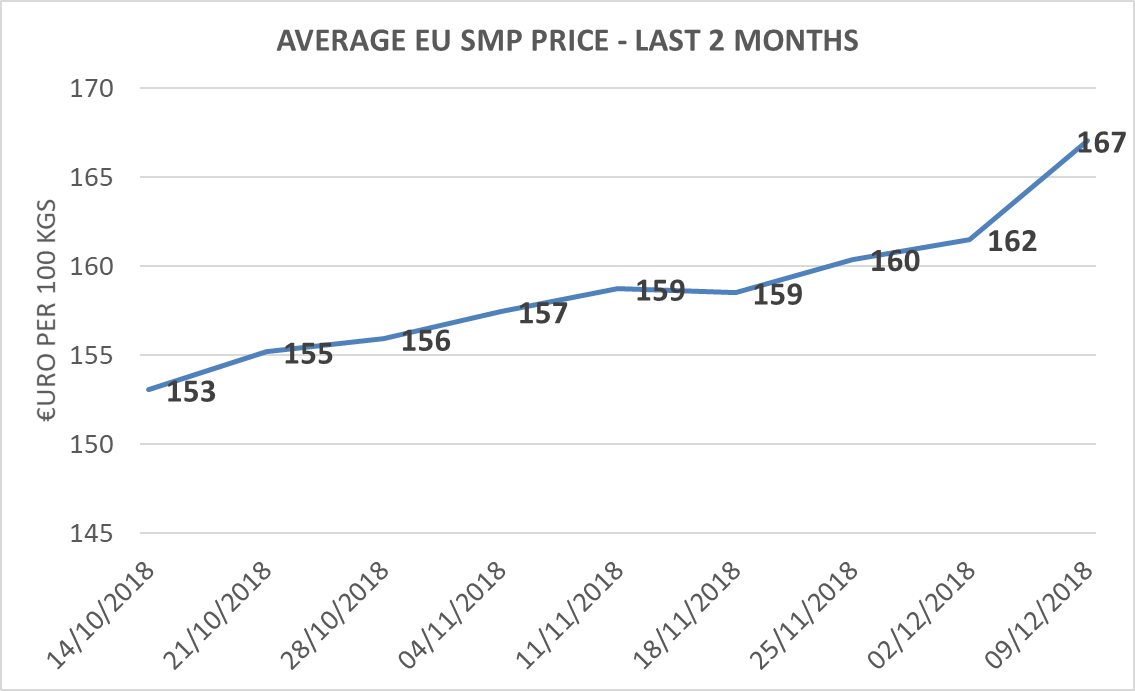
4. Rising fresh SMP market prices
SMP prices have been firming progressively since mid-October, coinciding with the largest sales out of intervention (see graph above).
As at 9th December 2018, the EU MMO reported the average EU SMP price at €1670/t.
Spot quotes for SMP have also been increasing steadily for the last couple of months. On 12th December, those had exceeded the intervention buying in level and exceeded €1700/t for the first time in months.
Based on: EU MMO data
Source: INTL FCStone
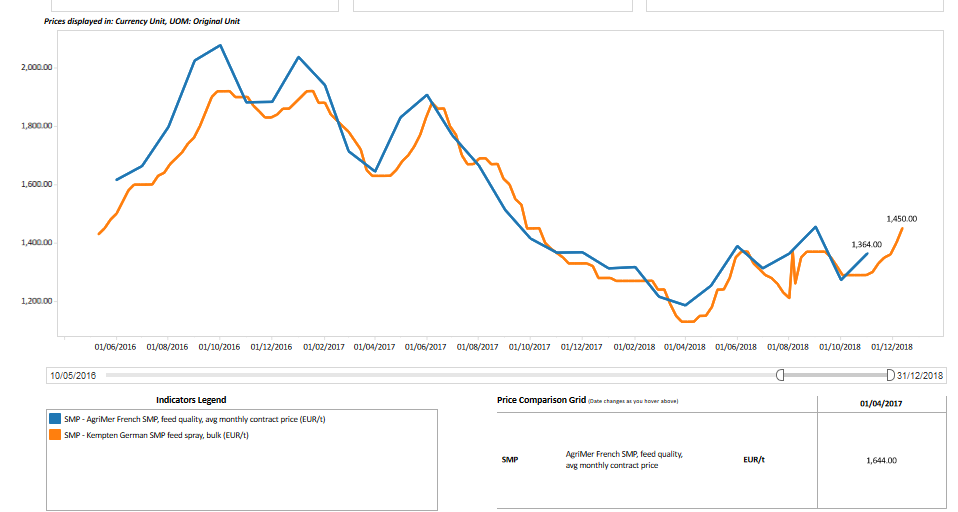
Quotes for feed grade SMP have also been improving over the same period (see graph below). It is fair to assume that the sales out of intervention cater mostly to this market. And the minimum price reached in the December sale was very much on par with the type of prices currently being paid for the fresh product.
Source: IEG Vu
5. Demand somewhat flat currently but looking to improve in New Year
Demand growth had been assessed at around +1.5% earlier this year. Lower oil prices, trade tariff disputes and weaker economic growth in many regions has flattened it a little in the last quarter of the year.
However, Chinese demand has increased in the earlier part of 2018, and is expected to increase in 2019 also.
Rabobank predict that, in 2019, Chinese demand will increase in double digits. The cost of production is rising in China, with feed costs on the up partly as a result of the tariff/trade war with the US. Chinese economic growth is however somewhat uncertain and this will impact demand for additional imports. Even allowing for this, however, Rabobank predicts an increase in Chinese dairy consumption for 2019 of 1.5% year on year.
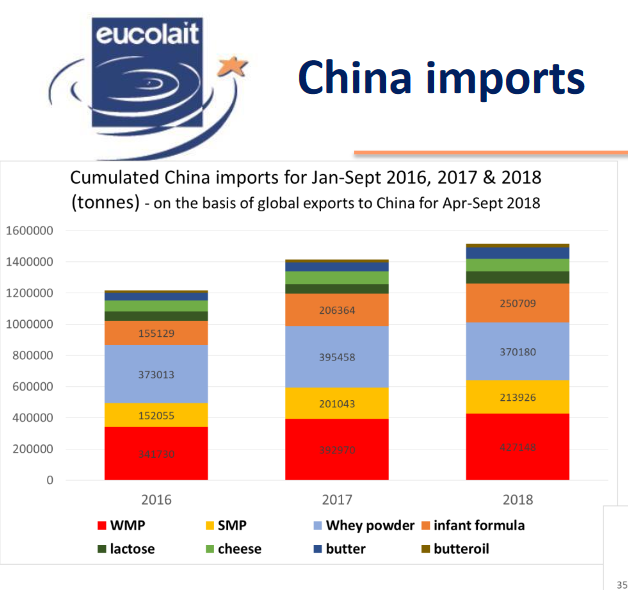
Source: Eucolait
In South East Asia, powder demand (including casein) has increased after a poor start to the year. Butter and cheese imports have also increased, though from low levels.
Rabobank predict that the relative global production squeeze is set to continue into 2019, and bearing in mind relatively low levels of privately held stock – also fast shrinking SMP intervention inventories – and continued steady demand, they say there is a real risk that buyers may get caught out with the market “moving quickly upwards and catching them unawares” in the first half of the New Year.
6. Not all rosy: Brexit, oil prices, international tariff wars
As 2018 comes to a close, there are some headwinds.
Brexit Day, 29th March 2019, is just over 100 days away, and the British, Irish Governments and the EU are now openly talking about preparing for the UK crashing out without a deal (a Hard Brexit).
It is worth reminding ourselves of a few dairy facts when it comes to our trade with the UK.
The UK imports 476,533 tonnes of all manners of dairy products from Ireland, but most of all cheese (138,000t) including a majority of Cheddar, and butter (49,000t).
They also export around 936,520 tonnes of dairy products to Ireland – this is mostly raw liquid milk from Northern Ireland which is being processed in the ROI.
So, firstly, the value of the UK imports from Ireland exceed its exports in value terms; and secondly, there may not be sufficient capacity within the UK to process the NI milk which is currently being processed in the ROI.
Hence, to quote the CLAL presentation from which the graph right and the information above is sourced, “Aside from political considerations, market equilibrium calls for the existence of a free trade agreement between the UK and the EU in order to limit the effect of Brexit on the constituents of the supply chain”.
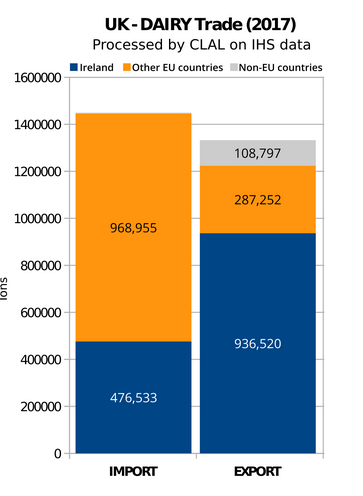
Source: CLAL.it
The most immediately apparent negative impact from the political chaos and uncertainty surrounding Brexit development is the weakness of Sterling. It makes our exports less competitive, and makes UK/NI milk cheaper to import, playing into the hands of retailers intent on unsustainable discounting, especially around Christmas as we have seen this week with fresh vegetables!
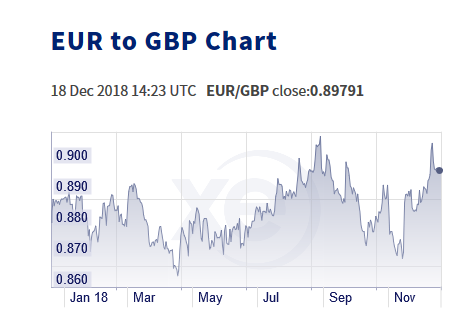
Source: Xe
Oil prices had risen very significantly during 2018, increasing export earnings for many emerging countries which rely on them to import their food necessities including dairy products.
In recent weeks, increased supply and the fear of economic headwinds potentially reducing demand has impacted crude oil prices, which have fallen dramatically to levels last experienced over 12 months ago.
Crude Brent oil went from US$87.54/barrel on 3rd October to around US$58-59/barrel in early December.
While Saudi Arabia is believed to be unlikely to risk upsetting the US by pushing too hard for OPEC output restraint (which would push up oil prices), Rabobank and other analysts nonetheless expect 2019 oil prices to average out in excess of 2018.
International tariff wars have also increased uncertainty on global markets. Trade tariffs imposed by the US on China in particular have increased the cost of feed, and consequently the cost of milk production. Paradoxically, this will, according to Rabobank, mean increased dairy imports in 2019. Recent attempts at thawing out commercial relations between China and the US have resulted in some import concessions on US soya – but whether those suffice to improve Chinese production costs remains to be seen.
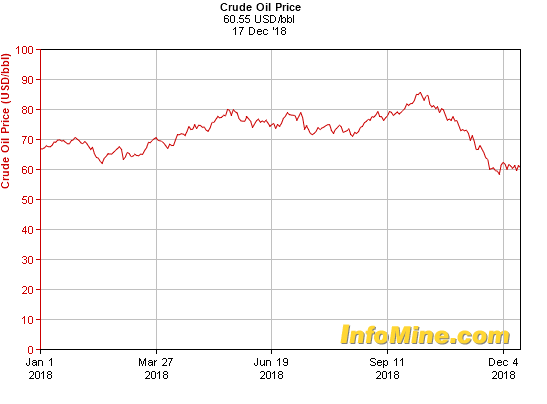
Source: InfoMine.com
7. Where are the main price indicators?
The below sums up the main indicators, many explored in some detail above, to assess what they indicate by way of milk price equivalent levels. It is clear that, despite the last two positive auctions, the GDT levels still reflect significantly lower returns than EU indicators, showing a continued differentiation between markets.
That said, it is noticeable that the various indicators, all of which are quoted below before 5.4% VAT is added, remain close to prices currently being paid by the main milk purchasers of around 30-31c/l. This continues to prove our point that stability in farmgate milk prices, at worst, for the next few months at least, is a very sustainable and legitimate expectation from farmers!
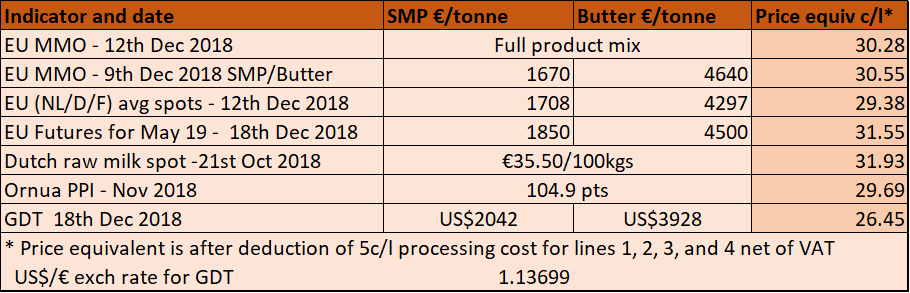
Based on data from: EU MMO, INTL FCStone, CLAL.it, Ornua, GDT